📌 This is Part 1 of a 2-part series: Part 1 (this post): Economic viability and cost analysis Part 2: Manufacturing Reality Check →
Last Updated: February 5, 2026
⚠️ Accuracy Disclaimer: This analysis synthesizes data from 60+ sources including SpaceX filings, FAA approvals, academic research, and industry reports. While we’ve made every effort to verify claims and cite primary sources, the rapidly evolving space industry means some figures may become outdated. Launch capacity approvals, cost projections, and timeline estimates should be treated as point-in-time assessments. When specific claims are unverified or based on company projections, we note this explicitly. Readers are encouraged to verify critical details independently.
In February 2026, Elon Musk’s SpaceX-xAI merger announced plans for “orbital data centers” at a combined $1.25 trillion valuation. SpaceX filed with the FCC to launch up to 1 million satellites for the “SpaceX Orbital Data Center System,” claiming that “within two to three years, the lowest cost way to generate AI compute will be in space.”
Analyst estimates for full build-out reach $5 trillion—more than 10x what the five largest tech companies plan for terrestrial data centers combined.
Can this possibly work? The answer depends on two critical constraints that define the AI infrastructure landscape.
2. Key Insights (2-Minute Summary)
If you only have two minutes, here’s what matters:
- Electricity is the constraint: AI data centers grow at 15% annually while electricity grids grow at 2%—a significant portion of projects are already delayed
- Launch costs must fall 10-20x: Space needs $50-200/kg to compete; current Starship estimates are $600-1,200/kg
- Musk’s timeline is aggressive: 70+ flight reusability and $10-20/kg costs would be unprecedented—Space Shuttle averaged 27 flights over 30 years
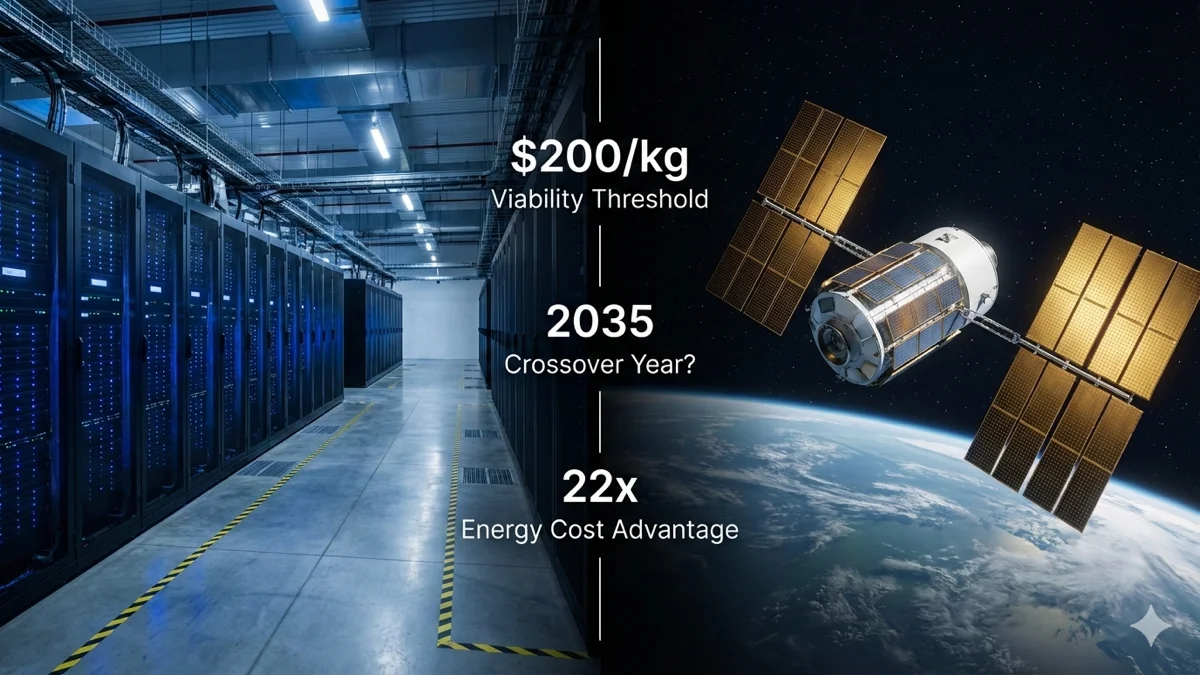
- Realistic timeline is mid-2030s: Not 2-3 years, but space becomes viable when launch costs hit $200/kg threshold (Google’s analysis)
- Use the calculator below: Test your own assumptions about Musk’s claims versus aerospace reality
3. The Two Limiting Factors
3a. Earth’s Electricity Crisis: The 15% vs 2% Problem
AI data centers face a fundamental mismatch: compute demand grows at 15% annually while global electricity generation grows at just 2% annually.
The numbers tell the story:
- 2024 consumption: 415 TWh globally; in the U.S., data centers consumed 183 TWh (4.4% of national electricity)
- 2030 projection: 945 TWh—requiring $6.7 trillion in infrastructure investment
- Current impact: Industry reports indicate a significant portion of planned data center projects already face delays due to grid constraints
Sources: IEA Energy and AI Report
, Computer Weekly
, IIEARegional Examples: Where the Crisis Hits Hardest
Region Crisis Point Impact Ireland Data centers consume approximately 32% of national grid as of 2026
(up from 21% in 2023) Moratorium in Dublin until 2028 Singapore Electricity costs $0.20-0.30/kWh (3-4x U.S. rates) Premium power market Northern Virginia Loudoun County: 25% of global internet traffic Land prices hit $4M/acre (+40% YoY) Nordic Countries Lowest rates at $0.016-0.03/kWh with 90%+ renewables Still hitting transmission limits
Why this matters for space: When electricity becomes the bottleneck, suddenly paying $200/kg to launch solar panels that generate “free” power 24/7 starts looking attractive.
Key Takeaway: The electricity crisis isn’t coming—it’s already here. This creates the economic window for space-based alternatives, but only if launch costs fall dramatically.
3b. Space’s Launch Cost Reality: The $2,700 to $200 Journey
For space data centers to make economic sense, launch costs must fall from today’s $2,720/kg (Falcon 9) to under $200/kg according to Google’s 2025 analysis of Project Suncatcher.
Here’s the current trajectory:
| Vehicle | Cost/kg to LEO | Reusability | Status |
|---|---|---|---|
| Falcon 9 | $2,720 | ~32 flights proven (Feb 2026) | Operational since 2010 |
| Falcon Heavy | $1,400-2,000 | Limited reuse | Operational, low cadence |
| Starship (today) | $600-1,200 | 0-6 flights projected | Testing phase |
| Starship (Musk target) | $10-20 | 70+ flights required | Unproven |
| Viability threshold | $200 | ~20-30 flights | Google’s 2035 target |
Sources: NASA NTRS , Google Research
The mass economics problem: A 1 MW orbital data center requires 30,000-100,000 kg of infrastructure:
- Computing hardware: 500-2,000 kg/MW
- Solar panels: 1,000-3,000 kg/MW
- Thermal radiators: 2,000-10,000 kg/MW (the dominant mass)
- Support structures: 20-30% of total
At current $2,000/kg rates, launching 1 MW costs ~$200 million before operations—versus $10-30 million for terrestrial construction.
In vacuum, all heat must dissipate via radiation rather than convection, following Stefan-Boltzmann physics. The International Space Station’s thermal control system requires 8 billboard-sized radiator wings weighing several tons to reject ~70 kW continuously. For AI computing workloads, radiators become the “dominant mass”—cooling infrastructure effectively becomes the payload. Radiator mass requirements: 2-10 kg per kW of heat rejection capacity Scale example: A 1 GW facility would need radiator mass exceeding the computing hardware itself. Sun-synchronous orbits providing continuous solar power make radiator sizing more demanding than orbits with eclipse “cool-down cycles.” Starcloud claims achieving PUE comparable to hyperscale terrestrial facilities, but independent verification remains limited. Source: Lumen Orbit WhitepaperDeep Dive: Why Thermal Radiators Dominate Space Data Center Mass
Key Takeaway: Launch costs must fall 10-20x from today’s levels. The question isn’t if this will happen, but when—and whether Musk’s 2-3 year timeline is physically achievable.
4. Earth Today: The Known Path
Despite the electricity crisis, terrestrial data centers remain the dominant paradigm through at least 2035.
Current Economics
Power Usage Effectiveness (PUE) has plateaued at 1.54-1.58 industry-wide, though hyperscalers achieve remarkable efficiency:
- Google: 1.09 global fleet average
- Meta: 1.08
- AWS: 1.15
- Immersion cooling: <1.03 (but requires $20-30M per MW versus $10-12M/MW standard)
Hardware costs follow predictable trajectories:
- NVIDIA H100 GPUs: $25,000-40,000 per unit
- GPU price-performance doubles every 2.5 years (Epoch AI analysis of 470 GPUs)
- Cloud H100 rental rates crashed 64-75% from peak: $8-10/GPU-hour → $2.10-5.00/GPU-hour currently
Hyperscaler capital expenditure reflects explosive growth:
| Company | 2025 CapEx | YoY Growth |
|---|---|---|
| Amazon | $125 billion | +61% |
| Microsoft | $80-121 billion | - |
| $85-93 billion | - | |
| Meta | $66-72 billion | - |
| Total | $350-405 billion | - |
2026 projection: $600+ billion aggregate industry CapEx
Sources: IEEE ComSoc
Construction costs vary by region and AI optimization: Sources: Cushman & Wakefield
, Thunder Said EnergyDeep Dive: Regional Electricity Cost Variations Drive Location Decisions
Region Cost/kWh Key Advantages Challenges Nordic $0.016-0.03 90%+ renewable, cold climate Transmission capacity limits Eastern Washington <$0.04 Hydroelectric power Limited available capacity U.S. Industrial Avg $0.07-0.08 Developed infrastructure Grid constraints in growth regions Singapore $0.20-0.30 Strategic location for Asia Extreme costs, government moratorium
Key Takeaway: Earth-based infrastructure benefits from decades of optimization, established supply chains, and predictable economics. Space must overcome a massive cost disadvantage to compete.
5. Space Tomorrow: Musk’s Vision vs Physics
5a. The Promise: What Musk Claims
Elon Musk’s orbital data center vision rests on several extraordinary claims:
Starship reusability: 70+ flights per vehicle with minimal refurbishment
- Marginal launch cost: $1 million per flight
- Result: $10-20/kg to LEO (versus $2,720/kg today)
Economic advantage: 22x lower energy costs (claimed)
- Space solar: $0.002/kWh effective cost (Starcloud projections - unverified)
- Earth wholesale: $0.045/kWh average
- Source: Starcloud/Y Combinator
- Note: Starcloud cost estimates are based on company projections for sun-synchronous orbits and have not been independently verified by space agencies or academic institutions.
Timeline: “Within two to three years” space becomes lowest-cost option
Scale: Up to 1 million satellites in the “SpaceX Orbital Data Center System”
- Estimated build-out cost: $5 trillion
5b. The Physics: Thermal and Radiation Constraints
Space computing faces fundamental physical challenges that Earth-based facilities don’t:
Thermal management in vacuum: All heat must dissipate via radiation rather than convection
- ISS radiators: 8 billboard-sized wings for ~70 kW
- AI workload scaling: Radiators become the dominant mass at MW+ scale
- PUE claims: Starcloud targets hyperscale-equivalent efficiency, but independent verification limited
Radiation hardening requirements:
- Commercial chips: 5-10 krad tolerance
- Space-grade chips: 100-300 krad tolerance
- Cost premium: 10-100x commercial pricing
- Performance penalty: Stuck at 150nm process nodes versus commercial 3-7nm
Latency considerations:
- LEO (Starlink): 33-45 ms median—comparable to terrestrial fiber over continental distances
- Satellite-to-satellite hops: 1.8-3.6 ms (SpaceX internal)
- Moon: 2.5-3 seconds round-trip—restricts to archival only
Google’s approach: Test commercial TPUs under proton bombardment The trade-off: Use cheap commercial chips with higher replacement rates, or expensive rad-hard chips with lower performance. Neither option clearly wins yet. Sources: Wikipedia Radiation Hardening
, Google ResearchDeep Dive: Why Radiation-Hardened Chips Lag Commercial Performance
Metric Commercial AI Chips Radiation-Hardened Space Chips Process node 3-7nm (cutting edge) 150nm (20+ years behind) Design lifespan 2-3 years 10-15 years Radiation tolerance 5-10 krad (permanent damage) 100-300 krad (mission-rated) Cost premium Baseline 10-100x higher Performance H100: 2,827 TFLOPS/kW ~10% of commercial equivalent
5c. The Economics: Launch Cost Breakdown
The fundamental equation for space data center viability:
Total cost per MW in orbit = (Mass per MW × Launch cost/kg) + Operations
Let’s work through the math:
At current Starship estimates ($900/kg):
- 50,000 kg/MW × $900/kg = $45 million/MW (launch only)
- Add operations, ground stations, replacements: $60-80M/MW all-in
- Versus Earth: $10-30M/MW
At Google’s viability threshold ($200/kg by 2035):
- 50,000 kg/MW × $200/kg = $10 million/MW (launch only)
- Add operations: $20-30M/MW all-in
- Approaching Earth cost parity
At Musk’s aspirational target ($10/kg):
- 50,000 kg/MW × $10/kg = $500,000/MW (launch only)
- Add operations: $2-5M/MW all-in
- Substantial cost advantage versus Earth
A 1 GW space data center—comparable to large hyperscale facilities—reveals the mass challenge: Mass requirements: Launch requirements: 100-200 Starship flights at 120-tonne payload capacity Cost at different launch prices: The implication: At Musk’s target costs, space infrastructure becomes dramatically cheaper than Earth. But getting there requires unprecedented reusability. Sources: Lumen Orbit Whitepaper
, calculations based on mass estimatesDeep Dive: The 1 GW Scale Challenge
Launch Cost Solar Panels Alone Total 1 GW Facility Comparison to Earth $2,000/kg (Falcon 9 today) $4.5B $18-50B 20-50x Earth cost $200/kg (viability threshold) $450M $1.8-5B 2-5x Earth cost $10/kg (Musk target) $22M $90-250M 0.1-0.25x Earth cost
5d. Critical Analysis: What Would Need to Be True
For Musk’s 2-3 year timeline and economics to work, all of the following must happen:
Starship Reusability: 70+ Flights Without Major Refurbishment
The claim: 70+ flights per vehicle with $1M marginal launch cost
The precedent:
- Space Shuttle: Averaged 27 flights over 30 years with extensive refurbishment between each
- Falcon 9: Currently ~32 flights proven (as of Feb 2026), with significant maintenance between flights
- Starship: 0 orbital flights reused to date
What would need to be true:
- Heat shield survives 70+ reentries without replacement
- Raptor engines run 700+ times (10 flights × 70 flights per vehicle × 33 engines) without major overhaul
- Structural fatigue from launch stresses proves negligible
- Turnaround time drops to days, not weeks/months
Probability assessment: This represents a ~2.2x improvement over the best reusable rocket ever flown (Falcon 9’s 32 flights as of Feb 2026), achieved with a vehicle 10x larger. Falcon 9 progressed from 15 flights (2022) to 32 flights (2026), demonstrating rapid reusability advances. Starship reaching 70 flights is ambitious but follows an established trajectory.
Launch Cost Economics: $10-20/kg
The claim: Marginal cost of $1M per flight ÷ 100,000 kg payload = $10/kg
The reality check:
- Starship build cost: ~$90M per vehicle (current estimates)
- Amortization: $90M ÷ 70 flights = $1.3M per flight (ignoring development)
- Ground operations, propellant, range fees: $0.5-1M per flight
- Actual marginal cost: $2-3M per flight = $20-30/kg
Customer pricing: SpaceX historically charges 2-3x internal costs
- Falcon 9 internal (Starlink): ~$28M
- Falcon 9 customer pricing: $67M (2.4x markup)
- Starship customer pricing could be: $50-100/kg even if internal costs hit $20-30/kg
What would need to be true: SpaceX passes through all efficiency gains to customers rather than capturing as profit margin.
Timeline: 2-3 Years to Dominance
The claim: Space becomes lowest-cost option by 2028-2029
What must happen by then:
| Milestone | Status Today | Required Progress |
|---|---|---|
| Starship orbital success | Testing phase | Must reach operational status |
| Reuse demonstration | 0 flights | Must prove 20-30 flight reuse minimum |
| Regulatory approval | 44 launches/year at Kennedy | Must scale to hundreds/year for 1M satellites |
| Manufacturing scale | ~1-2 vehicles/month | Must reach 10-20 vehicles/month |
| Satellite production | Starcloud demo only | Must reach 1,000s/month (Starlink scale) |
| Radiation testing | Limited commercial chip data | Must validate chip longevity |
| Ground station network | Early stage | Must deploy global coverage |
Regulatory progress: On January 30, 2026, the FAA approved Starship operations at Kennedy Space Center with a capacity of 44 launches and 88 landings per year (44 Starship upper stage + 44 Super Heavy booster landings). Combined with Boca Chica’s 25 Starship launches/year approval (granted May 2025), SpaceX’s total approved Starship capacity is 69 launches per year. Note: Cape Canaveral SLC-40’s 120 launches/year approval is for Falcon 9, not Starship, and cannot be used for orbital data center deployment.
The capacity challenge: Building a single 1 GW space data center requires ~100-200 Starship launches. At 69 launches/year capacity, SpaceX could theoretically deploy one 1 GW facility every 2-3 years—but Musk’s “1 million satellites” would require thousands of launches. Even at maximum approved cadence, this represents a 15-20 year buildout timeline, not 2-3 years.
Historical comparison: Falcon 9 took 8 years from first flight to routine reuse (2010-2018), and 12 years to reach current 15-flight reuse records.
Starship achieving 70+ flight reuse in 2-3 years would compress this timeline by 4-5x.
Continue to Part 2: Even if launch costs drop to $10/kg, physical and manufacturing constraints limit deployment speed. Musk’s “1 million satellites in 2-3 years” claim faces insurmountable barriers in factory capacity, regulatory approvals, and orbital mechanics.
→ Read Part 2: Why Musk’s 1M Satellite Timeline Is Physically Impossible
Part 2 covers: Manufacturing scale-up requirements, regulatory gauntlets, supply chain physics, orbital debris management, and why even unlimited capital can’t compress 20-year timelines to 2-3 years.
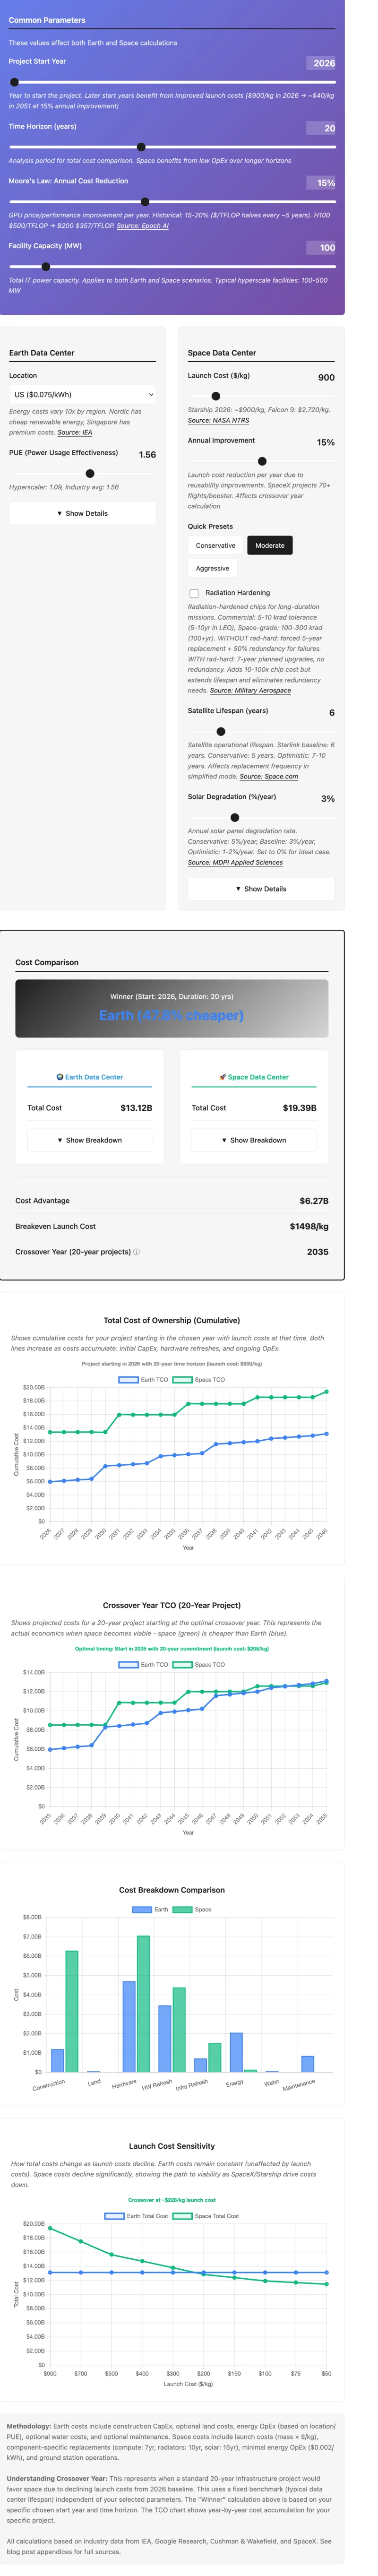
6. Interactive Calculator: Test the Assumptions Yourself
Use the calculator below to model different scenarios and see when space-based data centers become cost-competitive.
Recommended Scenarios to Try
Scenario 1: Musk’s Optimistic Case
- Launch cost: $20/kg
- Time horizon: 5 years (2031)
- Satellite lifespan: 7 years
- Solar panel degradation: 2%/year
- Result: Space becomes dramatically cheaper than Earth
Scenario 2: Conservative Aerospace Reality
- Launch cost: $200/kg
- Time horizon: 10 years (2036)
- Satellite lifespan: 5 years
- Solar panel degradation: 5%/year
- Result: Space approaches cost parity with Earth
Scenario 3: Electricity Crisis Accelerates
- Earth electricity cost: $0.15/kWh (up from $0.075/kWh baseline)
- Launch cost: $100/kg (moderate progress)
- Time horizon: 10 years
- Result: Space becomes attractive even without hitting $10-20/kg target
How to Use the Calculator
- Start with defaults: See baseline Earth vs Space comparison
- Adjust launch costs: Test what happens at $200/kg, $100/kg, $20/kg
- Modify time horizons: Compare 5-year, 10-year, 20-year outlooks
- Change electricity costs: Model regional variations or crisis scenarios
- Examine crossover points: Find exactly when space becomes cheaper
Understanding Results
- Total Cost per MW: All-in cost including construction, operations, replacements
- Levelized Cost: Annualized cost accounting for infrastructure lifetime
- Energy Cost Component: Ongoing electricity expense (where space has 22x advantage)
- Capital Cost Component: Upfront construction/launch expense (where Earth wins today)
7. When Space Makes Sense: Timeline Analysis
Based on the physics, economics, and precedent, here’s a realistic timeline for space-based AI infrastructure:
5-Year Horizon (2031): Demonstration Scale
Launch costs: $100-300/kg (Starship with 10-20 flight reuse)
Space capability: 10-100 kW clusters for testing and edge computing
Economics:
- Space all-in cost: ~$40-80M/MW
- Earth cost: ~$15-25M/MW
- Verdict: Earth remains 2-5x cheaper
Total addressable market: <$1 billion
Key developments:
- Starship reaches operational reusability (10-20 flights proven)
- Radiation testing validates commercial chip longevity in LEO
- Starcloud and competitors demonstrate MW-scale orbital computing
- Ground station networks deployed globally
10-Year Horizon (2036): Economic Crossover
Launch costs: $50-100/kg (mature Starship operations, early competition)
Space capability: 1-10 MW scale for specialized workloads
Applications that make sense:
- Satellite edge computing (processing for Earth observation constellations)
- Latency-sensitive global inference (lower latency than routing to distant ground facilities)
- Frontier training runs requiring >1 GW continuous power
- Regions with extreme electricity costs (>$0.15/kWh)
Economics:
- Space all-in cost: ~$20-50M/MW
- Earth cost: ~$20-30M/MW (rising due to electricity constraints)
- Verdict: Approaching cost parity for new capacity
Total addressable market: $10-50 billion
Terrestrial developments:
- Nuclear SMRs begin powering hyperscale facilities
- Fusion pilot plants reach demonstration scale
- Grid constraints delay 20-30% of projects in high-demand regions
25-Year Horizon (2051): Large-Scale Orbital Deployment
Launch costs: $10-30/kg (assuming continued trajectory)
Space capability: 10-100 GW aggregate capacity across constellations
Economics:
- Space-based solar: $0.01-0.02/kWh effective cost at scale
- Space all-in cost: ~$10-20M/MW
- Earth cost: ~$25-40M/MW (constrained by land, water, electricity access)
- Verdict: Space achieves cost advantage for new capacity
Applications:
- Large language model training (multi-GW continuous workloads)
- Global inference networks with <50ms latency worldwide
- AGI/ASI compute potentially exceeding Earth’s practical grid capacity in concentrated regions
- Specialized workloads requiring 24/7 solar access
Technology enablers:
- Neuromorphic and photonic architectures reduce thermal requirements by 10-100x
- In-space manufacturing reduces launch mass via asteroid-derived materials
- Lunar surface installations for cold storage and archival workloads
Total addressable market: $500B-1T annually
50-Year Horizon (2076): Space as Mainstream Infrastructure
Assumptions: No civilization-level disruptions, continued technological progress
Space share: 10-30% of total AI infrastructure
Capabilities:
- Multi-GW orbital facilities operate routinely
- Space-based solar power beaming enables GW-scale power transmission to Earth
- Lunar polar installations leverage constant solar and natural cryogenic cooling
- Effective compute costs in space fall below terrestrial due to unlimited solar access
Key uncertainty: Whether AGI/ASI emergence accelerates or decelerates this timeline
8. Critical Assumptions & Risks
Every projection above depends on assumptions that could prove wrong:
Starship Reusability Remains Unproven at Scale
The optimistic case: 70+ flights without substantial refurbishment
- Would revolutionize space economics
- Represents unprecedented engineering achievement
The pessimistic case: 10-20 flight reuse maximum
- Keeps launch costs at $200-400/kg
- Delays space viability to 2040s
- Still represents dramatic improvement over today
Historical precedent: Space Shuttle proved that reusability alone doesn’t guarantee low costs—complexity matters
What to watch: Starship flight 20-30 reuse demonstrations expected 2027-2029
Customer Pricing May Not Reflect Cost Reductions
SpaceX historical pattern:
- Falcon 9 internal cost: ~$28M (Starlink launches)
- Customer pricing: $67M (2.4x markup)
Implication: Even if Starship achieves $20/kg internal costs, customer pricing could be $50-100/kg
Counterargument: Competition from Blue Origin’s New Glenn and emerging players may force pricing down
AI Demand Growth Could Decelerate or Accelerate
Deceleration scenario:
- Algorithmic breakthroughs enable “good enough” performance without continued scaling
- Energy costs force industry consolidation
- Regulatory constraints slow deployment
- Result: Less pressure for space-based alternatives
Acceleration scenario:
- AGI arrives earlier than median expert projections (~2040)
- Inference workloads grow faster than projected
- Jevons Paradox: Efficiency improvements increase total consumption
- Result: Space becomes necessary rather than optional by 2030s
Power Grid Constraints May Prove Binding
Current situation: Industry reports indicate a significant portion of planned data center projects face delays
2030s projection: Up to 40-50% of projects in high-demand regions could be delayed
Regional examples:
- Ireland: Already at moratorium in Dublin
- Singapore: Government pause on new facilities
- Northern Virginia: Transmission upgrades require 5-10 years
Impact on space timeline: If terrestrial construction becomes bottlenecked, space alternatives become attractive even at $200-300/kg
Space Hardware Reliability Remains Challenging
Commercial chip longevity:
- Permanent damage at just 5 krad
- LEO dose: ~0.5-1 krad/year
- Lifespan: 5-10 years maximum without heavy shielding
Radiation-hardened alternatives:
- 10-100x cost premium
- 20+ year lag in process nodes (150nm vs 3-7nm)
- ~10% performance of commercial equivalents
Google’s approach: Test commercial TPUs, accept higher failure rates
- Survived 2 krad testing
- Still below long-duration mission exposure
- Strategy: Design for redundancy
On-orbit servicing: Currently $100-150M per mission—needs 10-100x cost reduction
Hardware Efficiency Improvements May Slow or Plateau
Moore’s Law assumption: The analysis assumes continued exponential improvements in computing efficiency across multiple dimensions:
- GPU price-performance doubling every 2.5 years (Epoch AI data)
- Architectural advances reducing power requirements (neuromorphic, photonic computing)
- Process node improvements continuing (even if slowing from historical rates)
If Moore’s Law slows or plateaus:
- Space thermal management becomes more challenging: Less compute per watt means larger radiators and higher launch mass
- Terrestrial electricity constraints worsen faster: Can’t “efficiency away” the 15% annual demand growth
- Timeline paradox: Slowing chip improvements might actually accelerate space adoption
Why the paradox?: When you can’t improve efficiency, unlimited solar power becomes more valuable. If terrestrial data centers hit a performance-per-watt ceiling while electricity demand continues growing, space’s 24/7 solar advantage becomes critical rather than optional.
Current status:
- Traditional Moore’s Law (transistor density doubling) has slowed significantly
- GPU efficiency gains remain strong: H100 → H200 → Blackwell shows continued progression
- Novel architectures offer potential breakthroughs:
- IBM NorthPole neuromorphic: 22x faster with 25x less energy
- Photonic computing demos: 7.48×10⁴ TOPS/W (orders of magnitude beyond electronic)
- Chiplet architectures and 3D stacking providing new scaling paths
Bottom line: The analysis assumes computing efficiency continues improving at roughly historical rates. If improvements slow, space becomes more attractive (electricity trumps efficiency). If novel architectures deliver 10-100x gains, space becomes less urgent (Earth can defer the electricity crisis longer).
9. Deep Dive Appendices
Training compute has doubled every 6 months since 2010, representing 4.4x annual growth: Source: AI 2027 Compute Forecast Inference is becoming the primary AI compute consumer: Per-query energy consumption: Source: arXiv ChatGPT Energy Analysis Algorithmic efficiency doubles every 8 months (Epoch AI): Hardware efficiency improves dramatically: Novel architectures promise transformational gains: The Jevons Paradox: Combined efficiency improvements deliver 3-5x annual gains, but AI demand grows at 4-6x annually—resulting in net energy consumption growth. Example: DeepSeek’s 45:1 efficiency over GPT-4 is projected to triple AI inference workloads by 2028 rather than reduce energy consumption. Sources: Epoch AI
, SemiAnalysisAppendix A: AI Demand Growth and Efficiency Paradox
Training Compute Growth
Inference Workload Dominance
Year Inference Share Training Share 2024 ~50% ~50% 2026 ~67% ~33% 2030 70%+ <30% Efficiency Improvements vs Demand Growth
November 2025 milestone: Launched Starcloud-1 with NVIDIA H100 GPU Funding: $21 million from NFX, Y Combinator, Andreessen Horowitz scouts Energy economics claim: ~$0.002/kWh using sun-synchronous orbits Approach: Commercial chips with designed redundancy rather than radiation-hardened alternatives Source: Starcloud/Y Combinator Announced: November 2025 Vision: Compact constellations of solar-powered satellites with TPUs Technical achievements: Economic analysis conclusion: Launch costs must reach <$200/kg by 2035 for viability Partner: Planet Labs building two prototype satellites by early 2027 Source: Google Research February 2025: Deployed first hardware data center on the Moon aboard Athena lander 2027 target: 15 petabyte system at Earth-Moon Lagrange point L1 Lunar advantages: Lunar disadvantages: Economics: Completely different from LEO orbital computing Source: IEEE SpectrumAppendix B: Space-Based Computing Milestones
Starcloud (Formerly Lumen Orbit)
Google Project Suncatcher
Lonestar Data Holdings: Lunar Computing
See original technical post for complete variable reference with 60+ sources.Appendix C: Quantified Variables Reference
Earth-Based Energy Costs
Variable Value Source Global DC electricity (2024) 415 TWh IEA Global DC electricity (2030) 945 TWh Data Center Dynamics U.S. DC electricity (2024) 183 TWh (4.4% of national) Network Installers Annual growth rate 15% IEA Nordic electricity $0.016-0.03/kWh Introl U.S. industrial $0.07-0.08/kWh Site Selection Group Singapore $0.20-0.30/kWh Introl APAC Space-Based Launch Costs
Variable Value Source Falcon 9 to LEO ~$2,720/kg NASA NTRS Falcon Heavy to LEO $1,400-2,000/kg NASA NTRS Starship current $600-1,200/kg Industry estimates Starship 6-flight reuse $78-94/kg Lumen Orbit Starship aspirational $10-20/kg SpaceX projections Viability threshold <$200/kg Google Research Starship payload 100-150 tonnes SpaceX specifications Construction & Hardware
Variable Value Source Standard CapEx/MW $10-15M Cushman & Wakefield AI-optimized CapEx/MW $20-40M Thunder Said Energy NVIDIA H100 GPU $25,000-40,000 GMI Cloud H100 cloud rental $2.10-5.00/GPU-hour Jarvislabs GPU perf doubling Every 2.5 years Epoch AI Space Infrastructure Mass
Variable Value Source Solar panels 1,000-3,000 kg/MW Lumen Orbit Thermal radiators 2,000-10,000 kg/MW Lumen Orbit Computing hardware 500-2,000 kg/MW Lumen Orbit Total infrastructure 30,000-100,000 kg/MW Calculated aggregate Radiator mass/kW 2-10 kg/kW Google Research Satellite Lifespan & Degradation
Variable Value Source Starlink lifespan 5-7 years Space.com Solar panel degradation 1.5-20% per year UT Austin Blue Skies Active Starlink satellites ~9,400 (late 2025) IDN Financials
For complete bibliography with 66+ sources, see the original technical post.Appendix D: Complete Source Bibliography
Energy & Infrastructure
Space & Launch
AI Compute & Efficiency
Hyperscaler Investment
Hardware & Radiation
Regional Analysis
Frequently Asked Questions
Quick Answers:
Q: Can space really be cheaper than Earth for AI? A: Yes, but only when launch costs fall below $200/kg. At Musk’s $10-20/kg target, space would have dramatic cost advantages due to free 24/7 solar power.
Q: What’s the biggest technical challenge? A: Achieving 70+ flight reusability with Starship—a 2.2x improvement over Falcon 9’s current record of 32 flights, at 10x the vehicle size.
Q: When will this actually happen? A: Mid-to-late 2030s for economic viability, not Musk’s claimed 2-3 years. Falcon 9 took 12 years to reach current reusability levels.
Conclusion: The Realistic Path Forward
Elon Musk’s $5 trillion orbital data center vision represents genuine technological ambition backed by real physics and economics—but the timeline is overly aggressive.
What’s realistic:
- Space-based AI infrastructure will become cost-competitive
- The crossover point is mid-to-late 2030s, not 2-3 years
- Launch costs reaching $50-200/kg make space viable for specific workloads
- Earth’s electricity crisis accelerates the timeline by making space alternatives attractive
What’s uncertain:
- Whether Starship achieves 70+ flight reusability (precedent suggests 20-30 more realistic)
- Whether SpaceX passes cost savings to customers (historical markup is 2-3x)
- Whether AI demand continues exponential growth (algorithmic breakthroughs could slow it)
- Whether radiation challenges prove solvable with commercial chips
The smart bet: Plan for terrestrial infrastructure dominance through 2035, but actively develop space capabilities for the 2035-2045 transition period. The companies that master both domains will win the long-term AI infrastructure race.
Use the calculator above to model your own assumptions—the future depends on which variables move fastest.
Related Reading:
- Original Technical Analysis (Draft) - Full quantified research with 66 sources
- How Brains and AI Work (Simplified) - Curious how biological and artificial neural networks compare? Explore the fundamental similarities and differences
Feedback: Found an error in the analysis? Have updated data on Starship reusability? Contact the author with corrections or suggestions.
Analysis by AI Augmented Software Development | Last updated February 5, 2026